Cloudian HyperIQ
Single-Screen View of Storage and Infrastructure
Observability and Analytics for your Cloudian Environment
Enterprises choose Cloudian HyperIQ to
Monitor Infrastructure
Single screen view of networks, servers, and storage.
View Capacity Utilization
See which users and applications are consuming capacity.
Manage Alerts
Set alerts for the metrics that matter most to you.
View User Behavior
Monitor data access for service quality and compliance.
View system health, performance, and usage
Gain operational insights with Cloudian HyperIQ, a monitoring and predictive analysis tool. View data from across your Cloudian environment, including storage and networking. Set thresholds and alerts to highlight potential issues and identify corrective action. Within a single site or across multiple locations, HyperIQ gives you real-time insights.
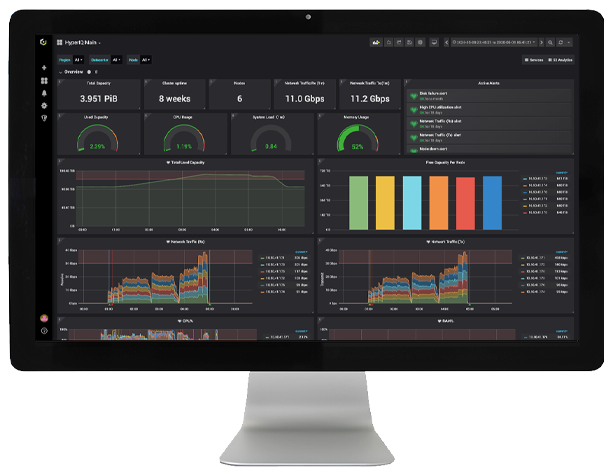
Intelligent Monitoring
Interactive dashboards give you complete observability into Cloudian infrastructure. View current and historical data to identify trends and monitor system health. Predict capacity usage, troubleshoot performance issues, and monitor usage patterns. Filter data for specific users or resources to pinpoint potential challenges.
Predictive Maintenance
Predict hardware failures, assess maintenance needs, and avoid impact on performance. Gain insights on capacity availability and component health. Programmable alerts inform you when preset thresholds are reached, so you can be proactive.
User Behavior Analytics
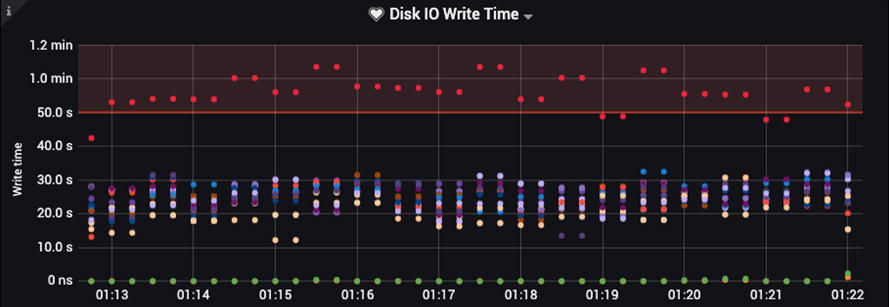
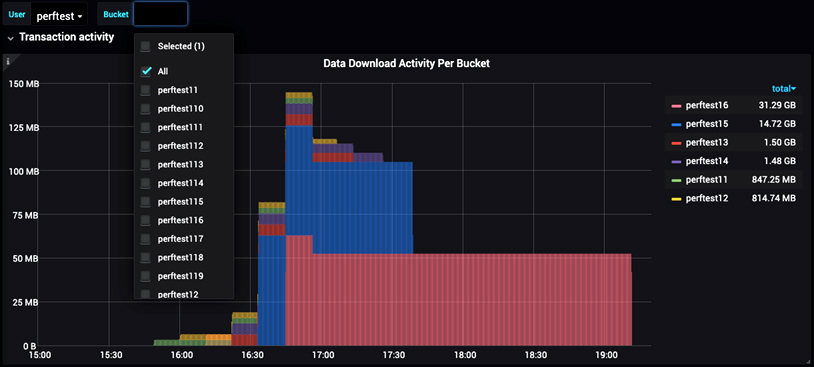
Monitor user activity to ensure both data security and high service levels. Configure alerts to keep you apprised when latencies exceed expectations, or when critical users or applications encounter issues. Spot abnormal usage patterns, including repeated attempts to remove a locked object, and track down unauthorized data access with detailed API call logs.
Realtime Alerts
Set alert thresholds and limits, then receive a notification via email, Slack, PagerDuty, and more. Detect performance issues and manage your SLAs. Stay apprised of the metrics that are the most critical to you, across users and infrastructure.

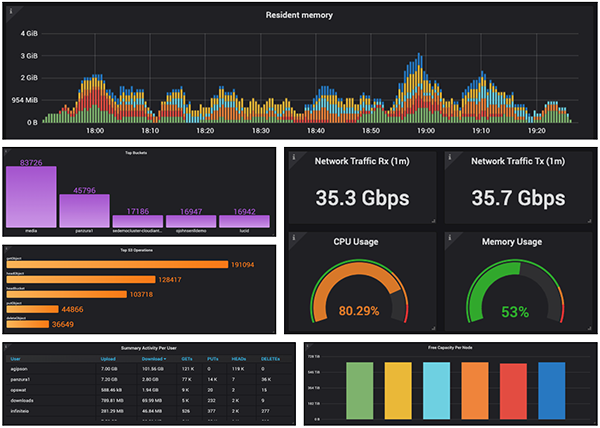
Build Dynamic Dashboards
Use pre-configured dashboards, or build your own from over 100 available data panels. Slice data by user or storage components for granular views, and zoom in for closer looks. Easily customize data panels, interactively or in code. Access your information anywhere you are, so you’re always informed.
TECHNICAL DEMO


